React 数据网格
React 数据网格 是一个为 ReactJS Web 框架设计的数据网格。
¥React Data Grid is a data grid designed for the ReactJS web framework.
SheetJS 是一个用于从电子表格读取和写入数据的 JavaScript 库。
¥SheetJS is a JavaScript library for reading and writing data from spreadsheets.
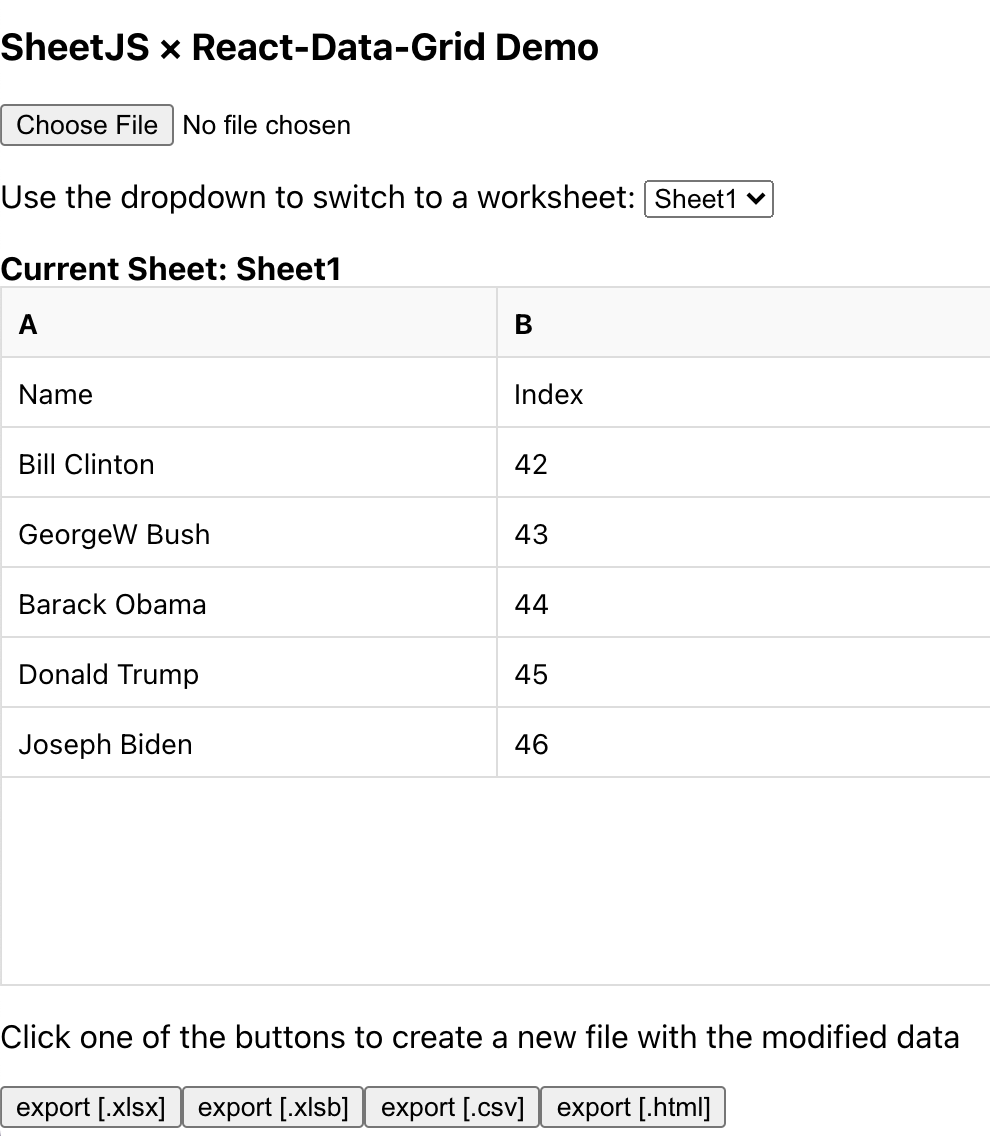
该演示使用 React Data Grid 和 SheetJS 从电子表格中提取数据并在数据网格中显示内容。我们将探讨如何将数据从文件导入到数据网格以及如何将修改后的数据从网格导出到工作簿。
¥This demo uses React Data Grid and SheetJS to pull data from a spreadsheet and display the content in a data grid. We'll explore how to import data from files into the data grid and how to export modified data from the grid to workbooks.
"演示" 部分包括一个完整的示例,该示例显示用户提供的工作表中的数据并将数据导出到 XLSX 工作簿:
¥The "Demo" section includes a complete example that displays data from user-supplied sheets and exports data to XLSX workbooks:

本 demo 在以下环境下进行了测试:
¥This demo was tested in the following environments:
| 浏览器 | 版本 | 日期 | 注意 |
|---|---|---|---|
| Chromium 135 | 7.0.0-beta.19 | 2025-04-23 | 需要 ReactJS 18 |
| Chromium 135 | 7.0.0-beta.52 | 2025-04-23 | 不支持编辑 |
| Konqueror 22 | 7.0.0-beta.52 | 2025-04-23 | 不支持编辑,CSS 错误 |
上次针对最新版本测试此演示时,网格正确显示数据,但用户无法编辑数据。
¥When this demo was last tested against the latest version, the grid correctly displayed data but data could not be edited by the user.
目前建议使用 7.0.0-beta.19 版本,并强制将 ReactJS 降级到 18 版本。
¥The current recommendation is to use version 7.0.0-beta.19 and to forcefully
downgrade ReactJS to version 18.
集成详情
¥Integration Details
"构架" 章节 涵盖了 Yarn 和其他包管理器的安装。
¥The "Frameworks" section covers installation with Yarn and other package managers.
使用 npm 工具,此命令安装 SheetJS 和 React Data Grid:
¥Using the npm tool, this command installs SheetJS and React Data Grid:
npm i --save https://cdn.sheetjs.com/xlsx-0.20.3/xlsx-0.20.3.tgz react-data-grid@7.0.0-beta.19
两个库中的方法和组件都可以使用 import 加载到页面中:
¥Methods and components in both libraries can be loaded in pages using import:
import { read, utils, writeFile } from 'xlsx';
import DataGrid, { Column } from "react-data-grid";
行和列状态
¥Rows and Columns state
react-data-grid 状态由列元数据数组和行对象数组组成。通常两者都在状态中定义:
¥react-data-grid state consists of an Array of column metadata and an Array of
row objects. Typically both are defined in state:
import DataGrid, { Column } from "react-data-grid";

export default function App() {
  const [rows, setRows] = useState([]);
  const [columns, setColumns] = useState([]);

  return ( <DataGrid columns={columns} rows={rows} onRowsChange={setRows} /> );
}
最通用的数据表示是数组的数组。为了满足网格,列必须是其 key 属性是转换为字符串的索引的对象:
¥The most generic data representation is an array of arrays. To sate the grid,
columns must be objects whose key property is the index converted to string:
import { WorkSheet, utils } from 'xlsx';
import { textEditor, Column } from "react-data-grid";

type Row = any[];
type AOAColumn = Column<Row>;
type RowCol = { rows: Row[]; columns: AOAColumn[]; };

function ws_to_rdg(ws: WorkSheet): RowCol {
  /* create an array of arrays */
  const rows = utils.sheet_to_json(ws, { header: 1 });

  /* create column array */
  const range = utils.decode_range(ws["!ref"]||"A1");
  const columns = Array.from({ length: range.e.c + 1 }, (_, i) => ({
    key: String(i), // RDG will access row["0"], row["1"], etc
    name: utils.encode_col(i), // the column labels will be A, B, etc
    editor: textEditor // enable cell editing
  }));

  return { rows, columns }; // these can be fed to setRows / setColumns
}
另一方面,可以使用 aoa_to_sheet 生成工作表:
¥In the other direction, a worksheet can be generated with aoa_to_sheet:
import { WorkSheet, utils } from 'xlsx';

type Row = any[];

function rdg_to_ws(rows: Row[]): WorkSheet {
  return utils.aoa_to_sheet(rows);
}
当演示最后一次刷新时,行数组对象被保留。在后来的版本中情况并非如此。必须重新创建行数组。
¥When the demo was last refreshed, row array objects were preserved. This was not the case in a later release. The row arrays must be re-created.
该代码片段定义了一个 arrayify 函数,该函数在必要时创建数组。
¥The snippet defines a arrayify function that creates arrays if necessary.
import { WorkSheet, utils } from 'xlsx';

type Row = any[];

function arrayify(rows: any[]): Row[] {
  return rows.map(row => {
    var length = Object.keys(row).length;
    for(; length > 0; --length) if(row[length-1] != null) break;
    return Array.from({length, ...row});
  });
}

function rdg_to_ws(rows: Row[]): WorkSheet {
  return utils.aoa_to_sheet(arrayify(rows));
}
演示
¥Demo
-
使用
react-ts模板创建一个新的 ViteJS 应用:¥Create a new ViteJS app using the
react-tstemplate:
npm create vite@latest -- sheetjs-rdg --template react-ts
cd sheetjs-rdg
-
安装依赖:
¥Install dependencies:
npm i -S https://cdn.sheetjs.com/xlsx-0.20.3/xlsx-0.20.3.tgz react-data-grid@7.0.0-beta.19
Installing RDG version that supports editing (click to show)
Editing support requires ReactJS 18 and React DataGrid version 7.0.0-beta.19:
npm i -S react@18 react-dom@18
npm i -S https://cdn.sheetjs.com/xlsx-0.20.3/xlsx-0.20.3.tgz react-data-grid@7.0.0-beta.19
curl -L -o src/App.tsx https://xlsx.nodejs.cn/rdg/App.tsx
-
启动开发服务器:
¥Start the development server:
npm run dev
终端窗口将显示一个 URL(通常为 http://localhost:5173)。使用 Web 浏览器打开 URL 并确认页面加载。
¥The terminal window will display a URL (typically http://localhost:5173).
Open the URL with a web browser and confirm that a page loads.
React DataGrid 的单点版本中存在重大变更!
¥There were breaking changes in point releases of React DataGrid!
JavaScript 控制台可能会显示引用 default 的错误消息:
¥The JavaScript console may show an error message referencing default:
Uncaught SyntaxError: The requested module '/node_modules/.vite/deps/react-data-grid.js?v=f9b1b87a' does not provide an export named 'default' (at App.tsx:2:8)
在小版本中,DataGrid 已从默认导出移至命名导出。必须编辑 src/App.tsx 脚本以反映更改:
¥In a point release, DataGrid was moved from the default export to a named
export. The src/App.tsx script must be edited to reflect the change:
import React, { useEffect, useState, ChangeEvent } from "react";
import { textEditor, Column, DataGrid } from "react-data-grid";
import { read, utils, WorkSheet, writeFile } from "xlsx";
更新脚本后,必须手动刷新网页。
¥After updating the script, the webpage must be manually refreshed.
测试
¥Testing
-
确认表格显示了总统列表。
¥Confirm the table shows a list of Presidents.
当页面加载时,它将获取 https://xlsx.nodejs.cn/pres.numbers,使用 SheetJS 进行解析,并将数据加载到数据网格中。
¥When the page loads, it will fetch https://xlsx.nodejs.cn/pres.numbers, parse with SheetJS, and load the data in the data grid.
-
单击 "导出 [.xlsx]" 按钮将网格数据导出到 XLSX。它应该尝试下载
SheetJSRDG.xlsx。¥Click the "export [.xlsx]" button to export the grid data to XLSX. It should attempt to download
SheetJSRDG.xlsx. -
在电子表格编辑器中打开生成的文件。将单元格 A7 设置为 "SheetJS 开发",将单元格 B7 设置为 47。保存文件。
¥Open the generated file in a spreadsheet editor. Set cell A7 to "SheetJS Dev" and set cell B7 to 47. Save the file.
-
使用文件选择器选择修改后的文件。表格将刷新并显示新数据。
¥Use the file picker to select the modified file. The table will refresh and show the new data.